HPS Quarter 1 2023 Financial Results
May 5, 2023

Hammond Power Solutions Inc. (HPS) a manufacturer of dry-type transformers, power quality products and related magnetics, has recently announced its financial results for the first quarter 2023.
HIGHLIGHTS
- Sales of $171 million in the quarter, increase of $43 million or 33.9% versus 2022
- Net Income of $15.7 million in the quarter, increase of $7 million or 83.5% compared to 2022
- Earnings per share of $1.32 for the quarter versus $0.72 for the same quarter in 2022
- Order backlog increased 74.1% versus Quarter 1, 2022
- Ending net operating cash balance of $7,127
“Following a robust 2022, we are starting 2023 off on the right foot with continued growth. Quotation activity is up significantly over both Q4 and the same quarter a year ago, and booking rates remain at or near our highest historical levels in diverse markets like renewable power generation, EV recharging, energy storage, data center construction, silicon carbide processing, industrial expansions, power quality, and large institutional projects like hospitals and industrial buildings,” said Bill Hammond, Chief Executive Officer of Hammond Power Solutions.
“Our production capacity expansion plans announced in December 2022 are proceeding as planned. The $40 million dollars of capital investment are expected to accommodate sales growth of $250 million over the next five years. These investments are being made in both existing plants as well as construction of a new plant to manufacture small products in Mexico. In addition to giving us the capacity to be more aggressive in growing our business and market share, it will also allow us to reduce our lead times and improve service to our OEMs and distributors.”
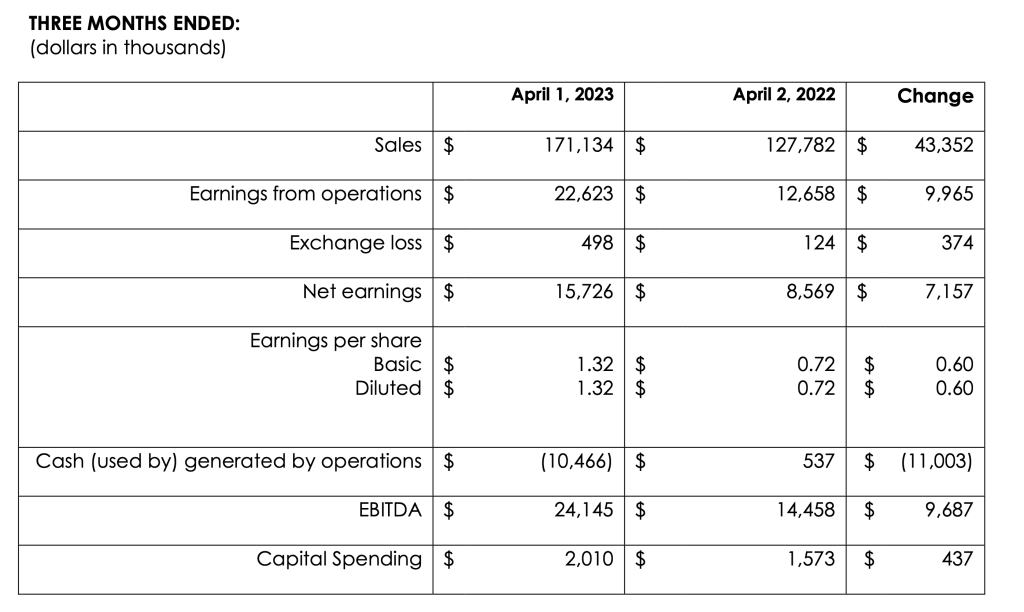
Sales for the quarter-ended April 1, 2023 were at a record level of $171,134, an increase of $43,352 or 33.9% from Quarter 1, 2022 sales of $127,782. Sales in the United States (“U.S.”) and Mexico (stated in Canadian dollars) increased by $35,693 or 42.9%, finishing at $118,804 for Quarter 1, 2023 compared to $83,111 in Quarter 1, 2022. U.S. and Mexican sales, (stated in U.S. dollars), were $88,138 in Quarter 1, 2023 compared to Quarter 1, 2022 of $65,624, an increase of $22,514 or 34.3%. Canadian sales decreased to $36,414 for the quarter, a decrease of $1,740 or 4.6% from Quarter 1, 2022 sales of $38,154.
Indian sales for Quarter 1, 2023 finished at $15,916 versus $6,517 in Quarter 1, 2022, an increase of $9,399 or 144.2%. Shipments were bolstered this quarter due to the recognition of $7,597 of revenue for an order produced and shipped in Quarter 4, 2022 that could not be recognized given sales terms of freight on board (“FOB”) destination.
The Company’s Quarter 1, 2023 backlog increased by 74.1% as compared to Quarter 1, 2022 and has increased 6.0% from Quarter 4, 2022. The combination of price increases and strong demand in the back half of 2022 and early 2023 along with delayed shipments contributed to the backlog increase from prior year.
“Growth in the quarter was mainly driven by sales through the U.S. Distribution channel, which has proven to be a consistent source of stable growth. We also had the added benefit of a stronger U.S. dollar and the recognition of additional India sales that were in transit at the end of last year. Setting aside these assists, we were still able to ship over $155 million in the quarter,” said Richard Vollering, Chief Financial Officer of Hammond Power Solutions.
“Gross margins continue to benefit from high factory throughput as we operate close to or at capacity in most facilities. We expect our efforts to increase capacity to begin to take effect in the second quarter of 2023 and continue to increase in the subsequent quarters.”
The Company saw an increase in its gross margin rate for Quarter 1, 2023, which was 31.8% compared to the Quarter 1, 2022 gross margin rate of 28.5%, an improvement of 3.3% of sales. The gross margin rate is impacted by productivity gains as a result of operating leverage, price increases implemented in 2022, and material procurement initiatives. Margin rates can be sensitive to selling price pressures, volatility in commodity costs, customer mix and geographic blend.
Higher gross margins were achieved in all channels and regions. The increase in sales volumes in 2023, along with similar organic increases in 2022, resulted in some facilities operating close to or at capacity. This volume increase resulted in higher fixed overhead leverage and as a result, higher gross margins.
Total selling and distribution expenses were $17,489 in Quarter 1, 2023 or 10.2% of sales versus $14,471 in Quarter 1, 2022 or 11.3% of sales, an increase of $3,018 or 20.9%. The year-over-year increase in selling and distribution expenses is a result of higher variable freight and commission expenses attributed to the large increase in sales.
General and administrative expenses were $14,335 or 8.4% of sales for Quarter 1, 2023 compared to Quarter 1, 2022 expenses of $9,247 or 7.2% of sales, an increase of $5,088 or 55.0%. The increase is due to our strategic investments in people, resources and incentive plans, along with Mesta and Mexico general and administrative expenses.
Quarter 1, 2023 earnings from operations were $22,623 compared to $12,658 for the same quarter last year, an increase of $9,965 or 78.7%. The increase in earnings from operations in the quarter is primarily a result of significant increases in sales and gross margin dollars offset by higher selling, distribution, general and administrative expenses, as well as higher income tax expense.
Interest expense for Quarter 1, 2023 was $200, a decrease of $63 compared to the Quarter 1, 2022 expense of $263. The foreign exchange loss in Quarter 1, 2023 was $498 compared to $124 in Quarter 1, 2022 – a change of $374.
Net earnings for Quarter 1, 2023 finished at $15,726 compared to net earnings of $8,569 in Quarter 1, 2022, an increase of $7,157. The increase in the quarter earnings from operations is primarily a result of significant increases in sales and gross margin dollars offset by higher selling, distribution, general and administrative expenses, as well as higher income tax expense.
EBITDA for Quarter 1, 2023 was $24,145 versus $14,458 in Quarter 1, 2022, an increase of $9,687 or 67.0%.
Basic earnings per share for the quarter was $1.32 versus $0.72 in 2022.
Cash used in operating activities for Quarter 1, 2023 was $10,466 versus cash generated by operations of $537 in Quarter 1, 2022, an increase in cash usage of $11,003. Total cash generated by financing activities was $4,061 in the first three months of 2023, compared to cash used of $366 in the same period in 2022. Cash used in investing activities increased year-over- year with cash used of $2,014 in Quarter 1, 2023 from $1,527 in Quarter 1, 2022, an increase of $487.
The Board of Directors of HPS declared a quarterly cash dividend of twelve and a half cents ($0.125) per Class A Subordinate Voting Share of HPS and a quarterly cash dividend of twelve and a half cents ($0.125) per Class B Common Share of HPS.
THREE MONTHS ENDED:
(dollars in thousands)

Caution Regarding Forward-Looking Information
This press release contains forward-looking statements that
uncertainties, including statements that relate to among other things, HPS’ strategies, intentions, plans, beliefs, expectations and estimates, and can generally be identified by the use of words such as “may”, “will”, “could”, “should”, “would”, “likely”, “expect”, “intend”, “estimate”, “anticipate”, “believe”, “plan”, “objective” and “continue” and words and expressions of similar import. Although HPS believes that the expectations reflected in such forward-looking statements are reasonable, such statements involve risks and uncertainties, and undue reliance should not be placed on such statements.
Certain material factors or assumptions are applied in making forward-looking statements, and actual results may differ materially from those expressed or implied in such statements. Important factors that could cause actual results to differ materially from expectations include but are not limited to: general business and involve a number of risks and economic conditions (including but not limited to currency rates); changes in laws and regulations; legal and regulatory proceedings; and the ability to execute strategic plans.
HPS does not undertake any obligation to update publicly or to revise any of the forward-looking statements contained in this document, whether as a result of new information, future events or otherwise, except as required by law.


