What Does the MTBF (Mean Time Between Failures) Tell You About System Component Reliability? An Analysis From Puls
April 14, 2023

Maximilian Hülsebusch
MTBF is the measure for the reliability of a device or system component. In this blog article you will learn what exactly is meant by MTBF, why it is an important quality indicator for power supplies and how it differs from service lifetime.
The term MTBF appears in the data sheets of various technical system components and often causes confusion. This is mainly due to the different calculation methods and the risk of confusion with the service lifetime of a device. At Puls, many R&D specialists deal with both parameters on a daily basis. With this knowledge, we bring a little light into the darkness in this blog article.
What is MTBF?
The term MTBF is the abbreviation for “Mean Time Between Failures”. The value is considered a measure of the reliability of electronic devices, assemblies or systems.
Users thus receive an expected value for how often a device fails on a statistical average. Of course, most manufacturers try to keep the number of failures as low as possible; however, it is inevitable that a technical device will fail with a certain probability. Knowledge of this value is particularly important for the maintenance of equipment.
How is the MTBF Calculated?
The MTBF is the reciprocal of the failure rate λ (lambda). The failure rate λ in turn indicates how many failures are statistically to be expected when operating a certain number of units over a certain period of time. Due to the specification in 1/hour, λ is a very small number.
The MTBF, on the other hand, is specified in hours and is thus easier to use in practice, which is why this value has become accepted as a common indicator of reliability.
The correlation between failure rate and MTBF becomes clear with a calculation example.
In a factory, 1,000 identical units are installed and operated for 2,000 hours. This results in a total of 2 million operation hours. If 4 units fail during this period of time, then the following calculation for the failure rate λ applies:

For the MTBF as the reciprocal of the failure rate, the following formula applies:

It is important to note that both the failure rate and the MTBF relate to statistical failures. These apply from the first hour of operation.
How to Visualize the MTBF?
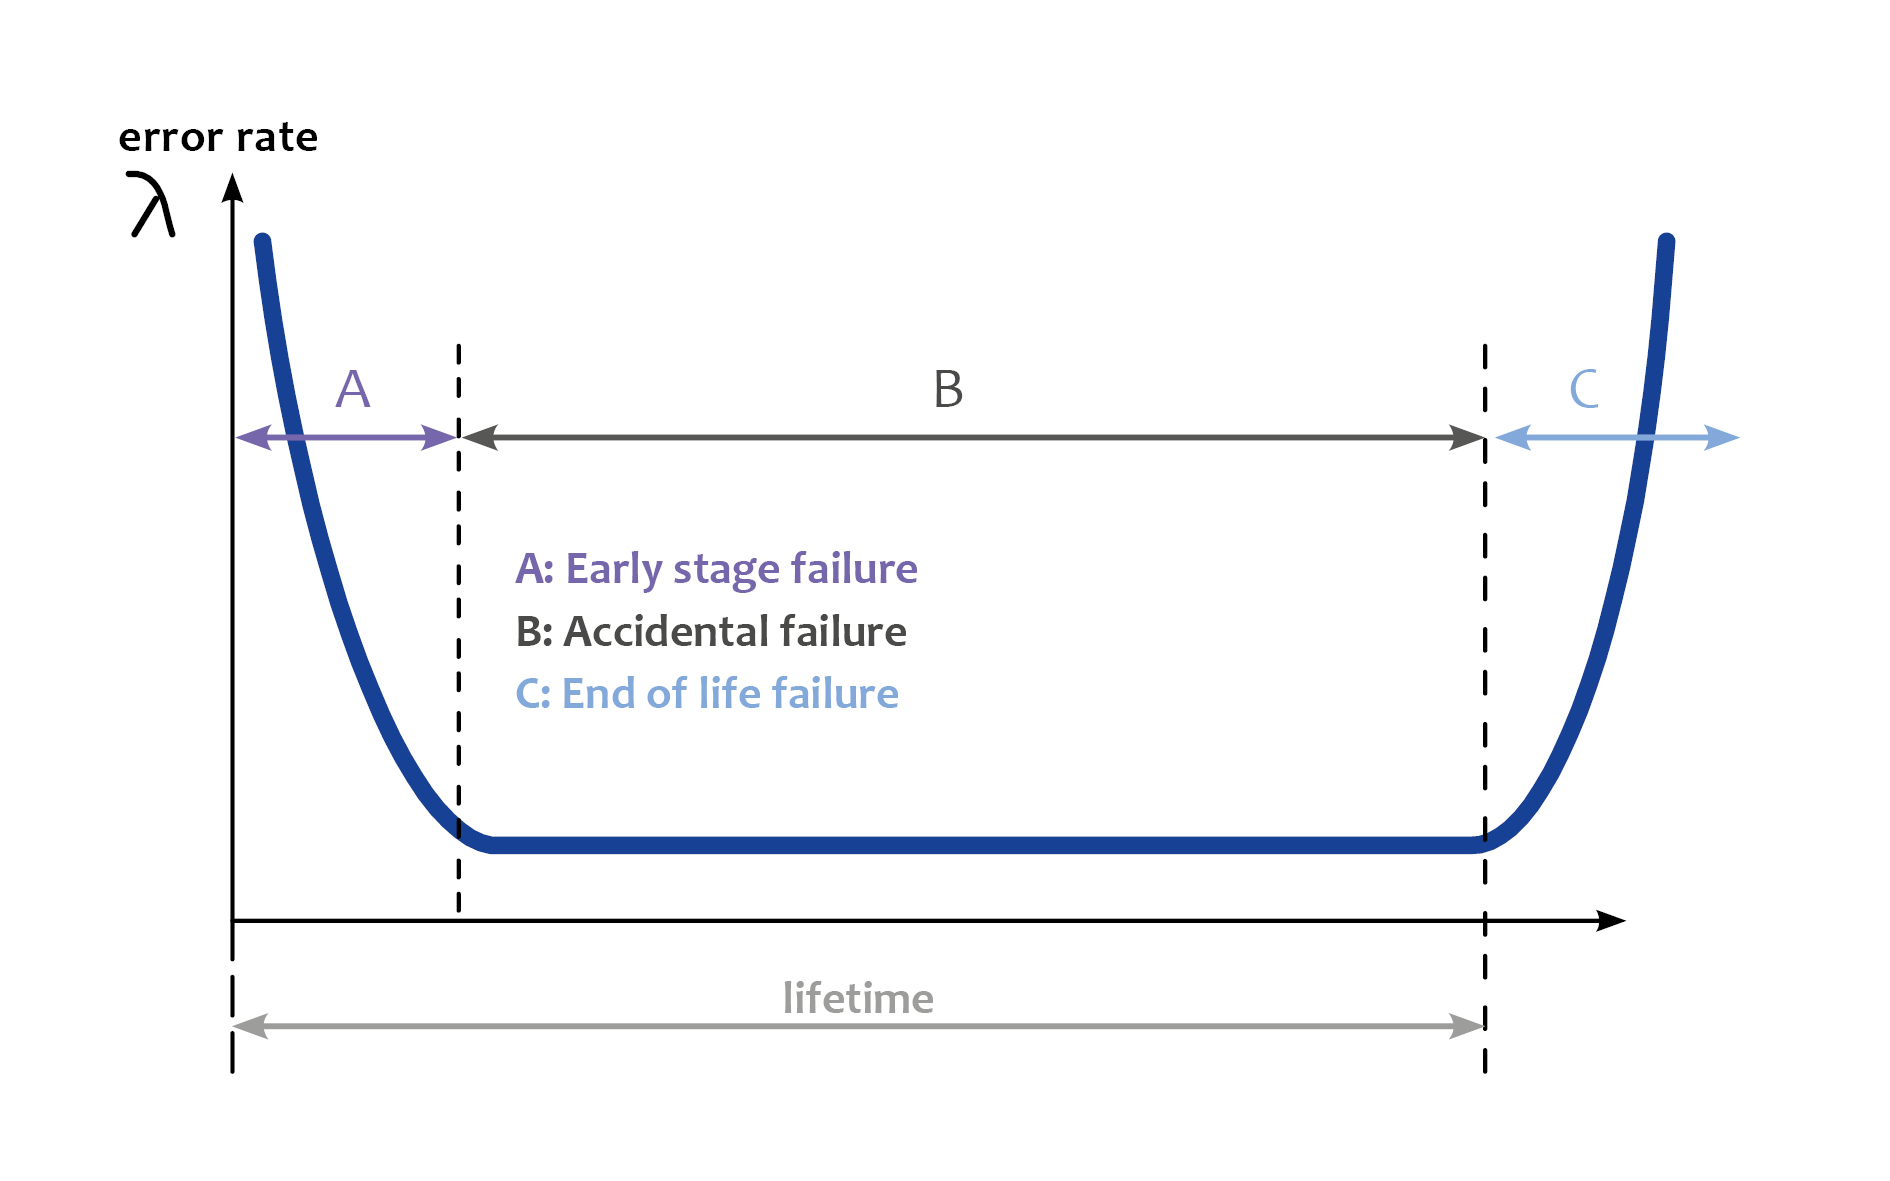
The best-known graphical visualisation of the MTBF is the so-called bathtub curve (see Figure 1).
Early failures (see phase A) are not taken into account in the MTBF, as the manufacturer should exclude them from being delivered to customers thanks to internal quality testing.
During the operational phase (see phase B), higher temperatures in particular can accelerate the processes that ultimately lead to failure. The thermal stress to which the components are exposed in such a case increases the failure rate. Therefore, system developers and maintenance specialists are primarily concerned with low temperatures in the application in order to keep the failure rate as low as possible.
By the way, wear effects (see phase C) are not included in the MTBF, as only the phase of the service lifetime is considered in which no age-related failures may occur.

How is the Failure Rate λ Determined in Practice?
The failure rate λ can be determined in different ways. Depending on which way is chosen, the results will differ. Users must therefore always refer to the specification and the underlying operating conditions for the determination of the failure rate or the MTBF values stated in the product data sheet.
Using the example of a DIN rail power supply we look at two different approaches for the calculation.
The quickest and simplest method to determine λ is the so-called “Parts Count”. Here, only the individual components in the power supply unit are counted and multiplied by an average failure rate. The result is then evaluated as the failure rate of the entire power supply unit. However, this method is inaccurate.
A much more complex alternative is to determine the failure rate for each individual component. For this purpose, the electrical load is calculated for each component and the thermal stress is determined by measurements. Based on these values, the failure rate for the component is determined via software. This procedure is common for PULS.
Various standards can be applied for the calculation of the failure rate. The MIL Handbook 217F is frequently used for the calculation on a global level. However, the failure rates determined on the basis of MIL are rather to be assessed as conservative. The values based on the calculation method of the Siemens standard SN 29500 according to IEC 61709 are more realistic.
The sum of the individual component failure rates finally results in the total failure rate λ of the power supply unit. Next the MTBF of the power supply unit can be calculated, as described above.
Good to Know!
MTBF values are worthless without naming the underlying standard and the operating conditions. In particular, the load conditions and the prevailing ambient temperatures are decisive. When comparing products from different manufacturers, special attention must be paid to these values and, if necessary, enquiries must be made.
PULS provides all information relevant to the MTBF in its product data sheets.
What is the Difference Between MTBF and Service Lifetime?
The data sheet information on service lifetime is not about statistical failures during the operating time. The service lifetime indicates the time after which the components become unusable due to wear.
In a power supply unit, special attention must be paid to the electrolytic capacitors. These components are considered to be life-determining, as they lose capacity over time due to the diffusion of electrolytes.
The electrolytic capacitor manufacturers specify an end of life in their data sheets. At this point, important parameters such as capacitance and internal resistance deviate from the initial value by a certain amount.
Electrolytic capacitors react particularly sensitively to high ambient temperatures. Every 10 °C increase in temperature shortens the service lifetime of the electrolytic capacitors by a factor of 2 and thus has a direct influence on the service lifetime of the power supply unit.
Why are the MTBF and Service Lifetime of a Power Supply Important?
Industrial power supplies should be reliable from the first minute of operation and at the same time secure the power supply of a system for many years. Therefore, both MTBF and service lifetime are important quality indicators of a power supply unit and should be at a high level.
At PULS, the reliability and service lifetime of its power supplies have always had a very high priority. The corresponding values for MTBF and service lifetime are described in detail in the data sheets of the devices and specified precisely for various operating conditions.
These reliable values make it easier for customers and users to plan and realize complex systems that are often made up of hundreds of system components.
At the same time, reliable and durable power supplies are also good for our planet. Because the power supply units need to be replaced less often, resources are conserved and less electronic waste is produced.


